Financial Information
Financial Highlights
Click the above link to go to the relevant section.
Business Trend
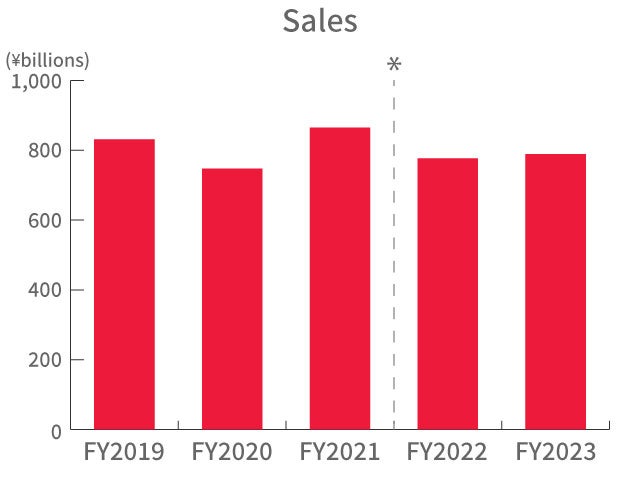
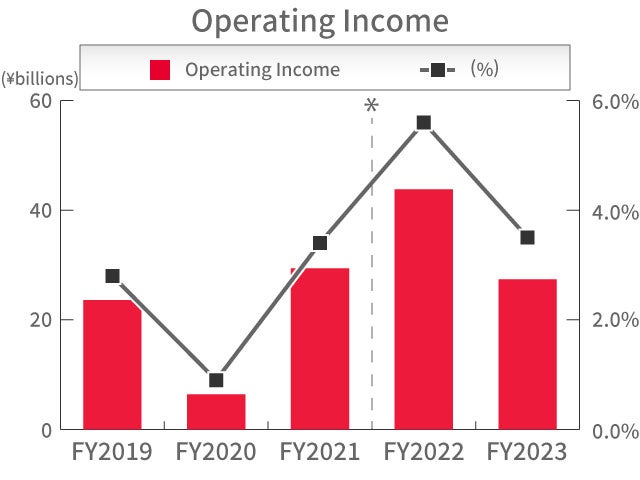
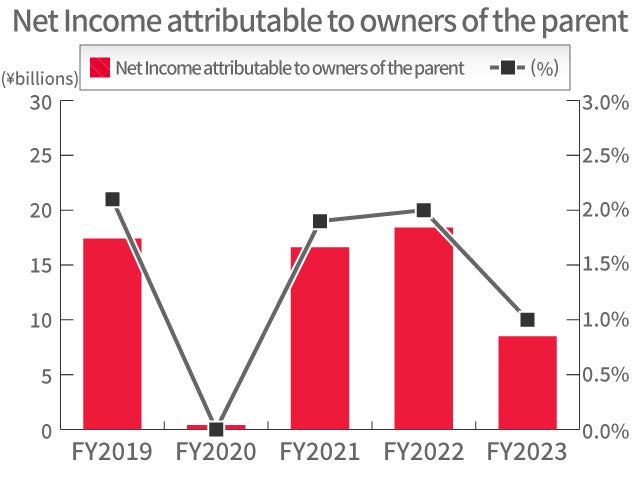
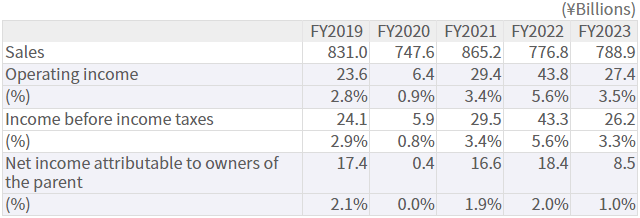
* Due to establishment of steering business as equity-method affiliate, figures for FY2022 have been reclassified to match current segments, excluding net income attributable to owners of the parent.
Breakdown by Business Segment
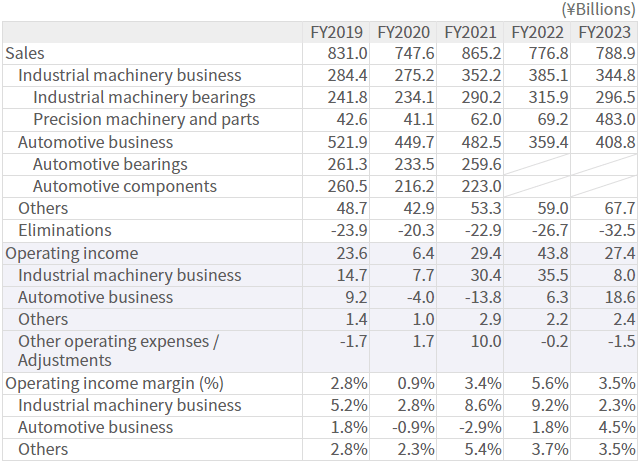
* Part of the others business segment was transferred to the industrial machinery business. Accordingly, figures for FY2021 have been reclassified to match current segments.
* Due to establishment of steering business as equity-method affiliate, figures for FY2022 have been reclassified to match current segments.
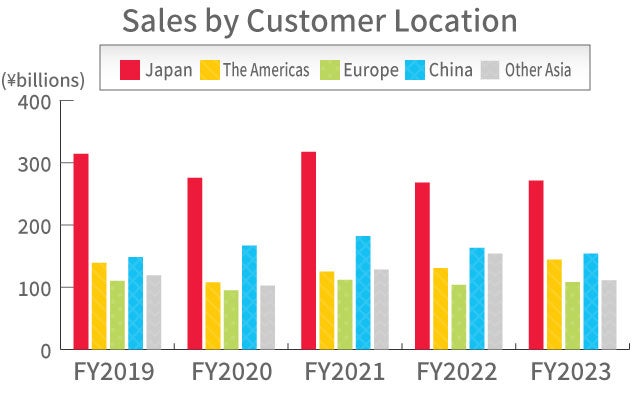
Breakdown by Region
Sales by Customer Location

ROE / ROA / Dividends / Total return ratio
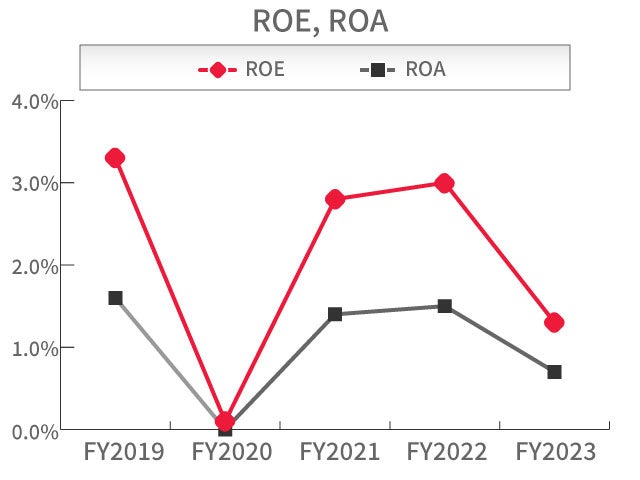
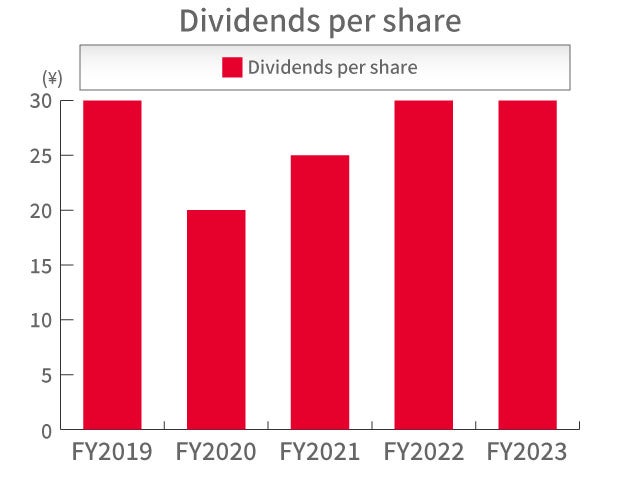

* Total return ratio = (Dividends paid + Amount of share repurchased) ÷ Net income
Assets / Equity / Debts / Inventories
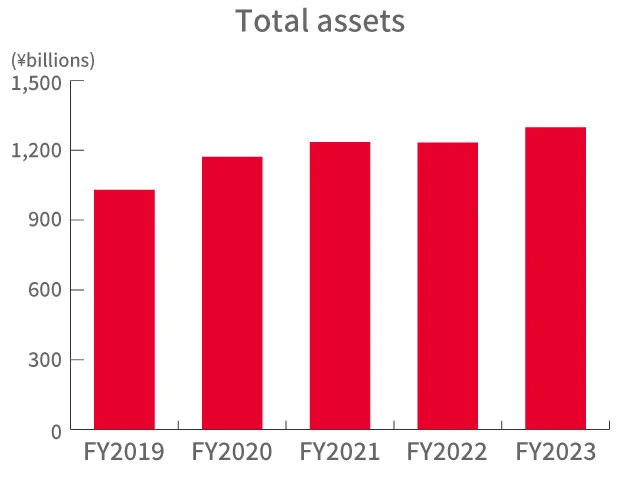
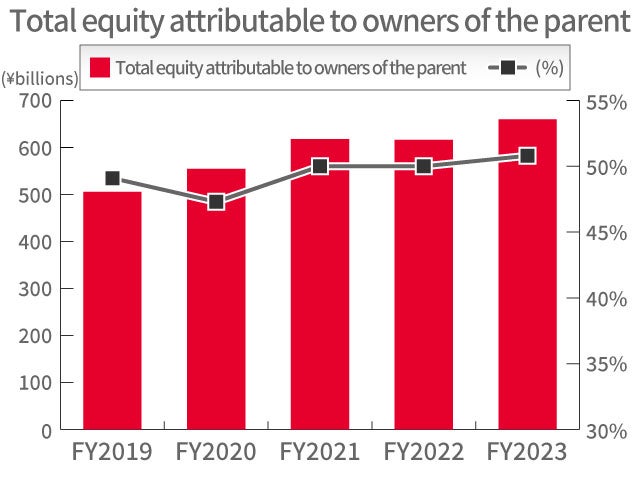
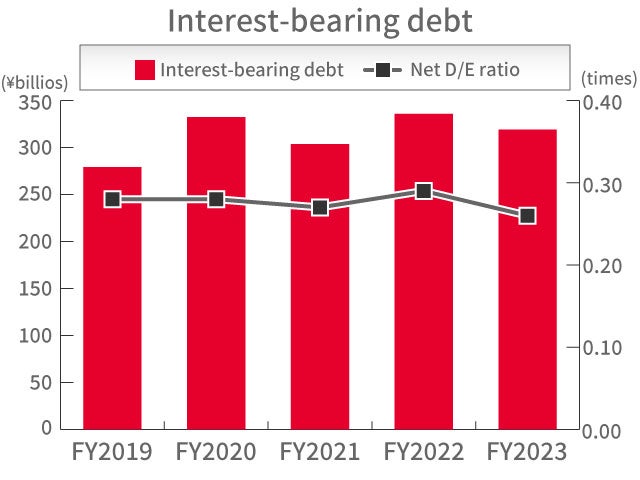
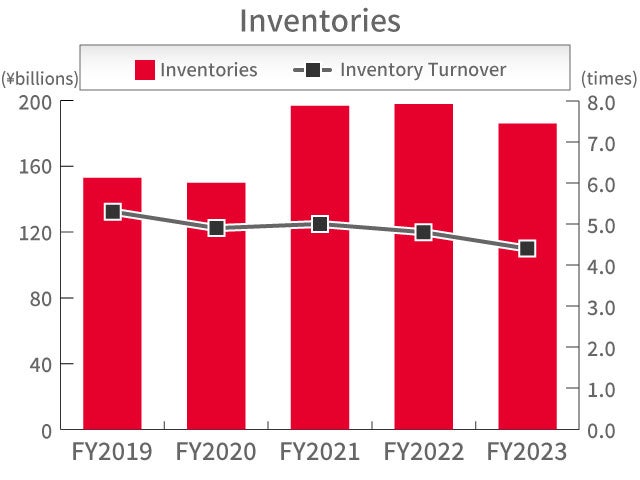
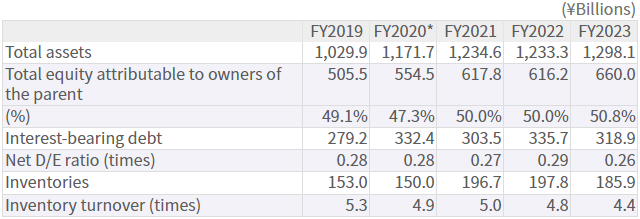
* In FY2021, NSK finalized the provisional accounting treatment for business combination. The consolidated financial statements for FY2020 reflect the revision of the initially allocated amounts of acquisition price.
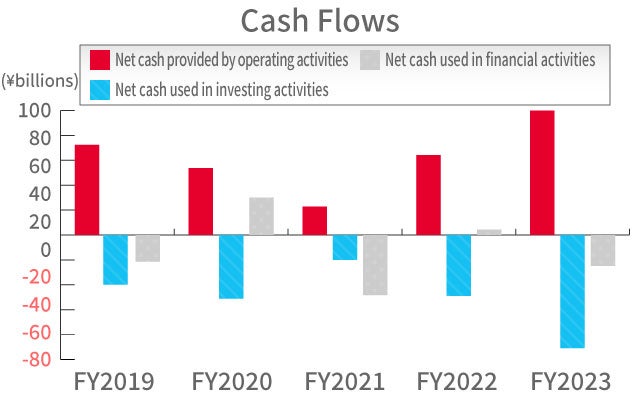
Cash Flows

Capital Expenditures / Depreciation and Amortisation
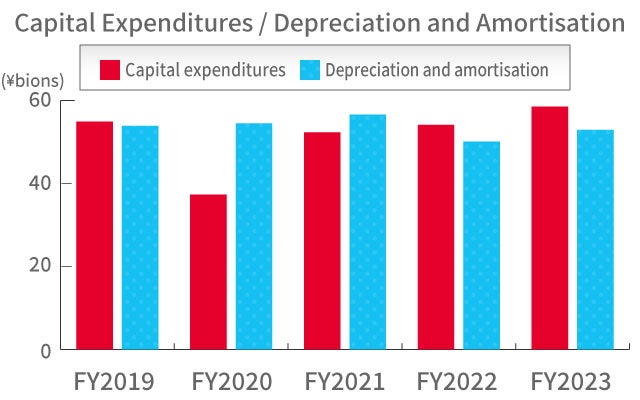

* Due to establishment of steering business as equity-method affiliate, figures for FY2022 have been reclassified to match current segments.
R&D Expenses
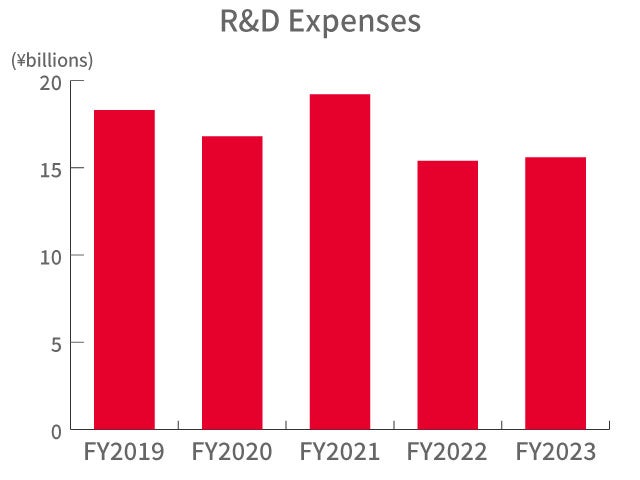

* Due to establishment of steering business as equity-method affiliate, figures for FY2022 have been reclassified to match current segments.
Business Segment Information
NSK has two business segments, the Industrial Machinery Business and the Automotive Business.
Industrial Machinery Business
The Industrial Machinery Business is involved in operations related to two product categories, namely industrial machinery bearings and precision machinery and parts.
Industrial machinery bearings meet a wide range of demands in all industries and come in a variety of types, ranging from miniature to extra-large size. On the other hand, represented by linear motion products, such as ball screws and linear guides as well as mechatronics products such as XY Tables and Megatorque Motor™, precision machinery products play key roles in machine tools and semiconductor/LCD production equipment, which require precise positioning. Possessing thorough knowledge of industrial characteristics, operating environments, and national/regional differences, both businesses respond appropriately to a variety of needs.
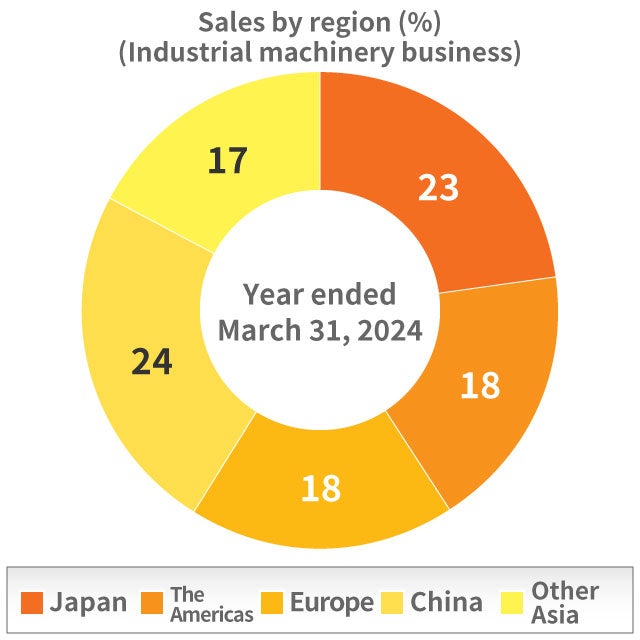
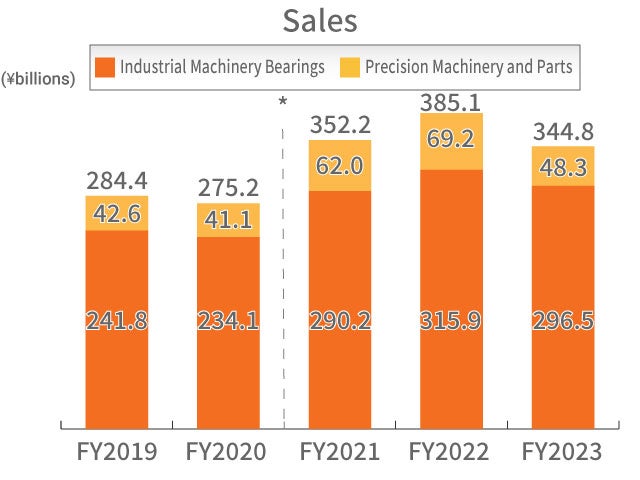
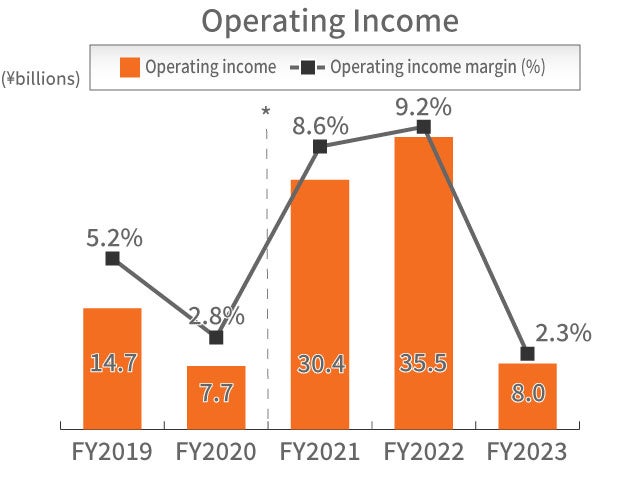
* Part of the others business segment was transferred to the industrial machinery business. Accordingly, figures for FY2021 have been reclassified to match current segments.
Automotive Business
The Automotive Business is developing a wide range of important functional parts that support the three critical elements of automobiles—namely running, turning and stopping. We provide various types of bearings used in automobiles, including hub unit bearings and needle bearings. The parts including those for automatic transmission (AT) products and ball screws for electric brakes are also provided.
Amid the accelerating innovation in automobile technologies, such as power source diversification and autonomous driving, we are advancing the development of new technologies and products, creating new value and making proposals.
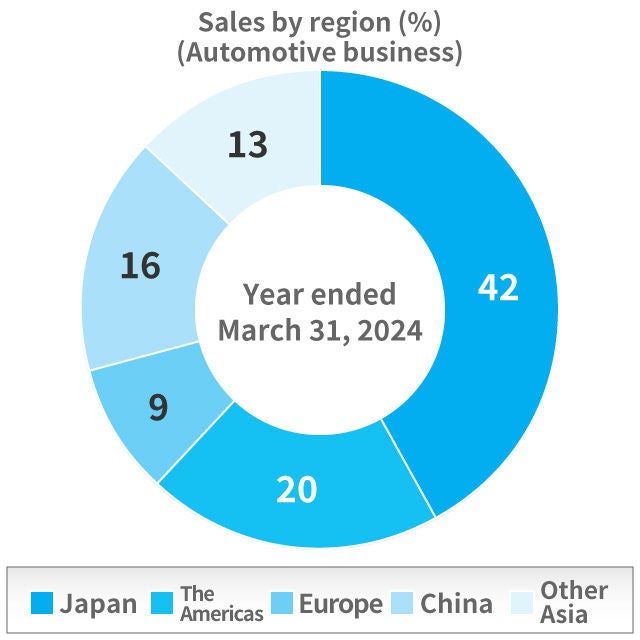
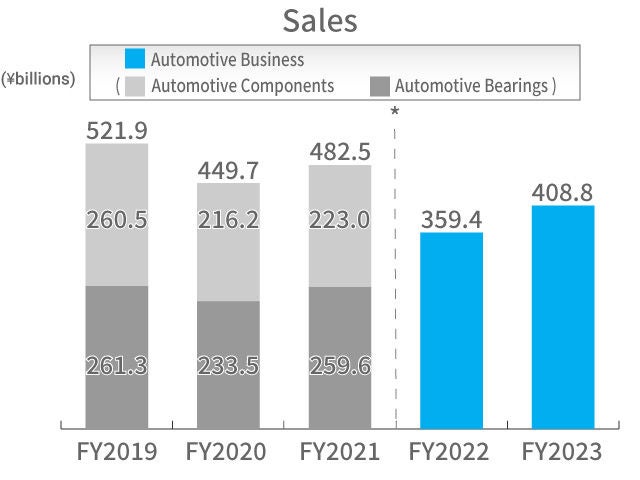
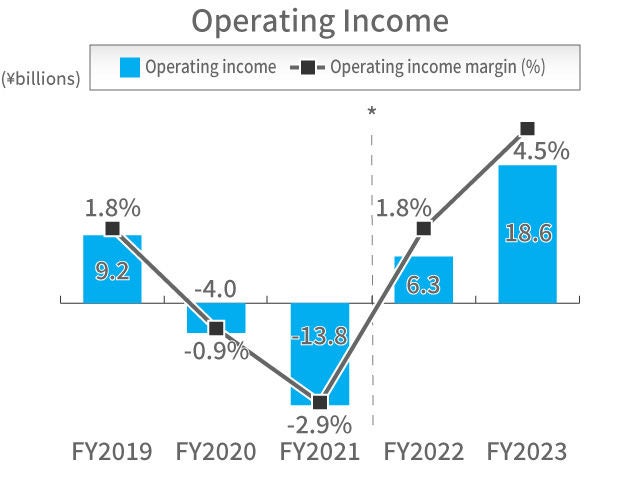
* Due to establishment of steering business as equity-method affiliate, figures for FY2022 have been reclassified to match current segments.
